Air Fryer & Small Kitchen Appliance Market Statistics 2027: 40 Cited Data Points
- Share
- publisher
- Kangye Electric Team
- Issue Time
- Nov 9,2026
Summary
A cited statistical roundup of the air fryer and small kitchen appliance markets for 2027 planning: four 2026 market-size estimates side by side, regional splits, household penetration in the US, UK and Europe, product-mix shares, US price ladders, online channel shares and the China-centered manufacturing footprint. Forty-plus data points, each with a year and a source, plus what they mean for private-label importers.
Short answer: the air fryer is a low-single-digit-billion category compounding at 7–12% a year inside a small kitchen appliance market worth $61–65 billion in 2026. Four 2026 estimates place the 2026 air fryer market between $1.53 billion (PW Consulting) and $6.02 billion (Tricity roundup); US penetration readings range from 45% to 67%, and 65% of UK households own one (Leatherhead, 2026). Every figure below carries a year and a source.
This roundup compiles 40+ cited statistics on air fryers and the small kitchen appliance market they anchor, organized by the dimensions an importer buys against: market size, regions, penetration, product mix, pricing, channels and manufacturing footprint. Where sources disagree — and they disagree widely — we show the estimates side by side and flag the scope difference instead of picking a winner. Our companion OEM statistics compilation covers MOQs, lead times and tooling costs; this article stays on the demand side.
How big is the air fryer market? Four 2026 estimates, side by side
Published 2026 estimates for the global air fryer market span $1.53–6.02 billion for the same calendar year — a 4× spread that is entirely about scope, not error. Narrow counters track basket-style countertop units only; broad counters fold in oven-style air fryers, multi-cooker hybrids and accessories. Each estimate below carries its own scope note, and the paragraph underneath the table shows the growth mechanism shifting from first-time adoption to replacement and premiumization.
| Source, year | 2025 | 2026 est. | Forecast | CAGR | Scope note |
|---|---|---|---|---|---|
| 360iResearch, 2026 | $1.61B | $1.72B | $2.65B by 2032 | 7.41% | By type, capacity, channel |
| PW Consulting, 2026 | $1.36B | $1.53B | $2.46B by 2032 | 8.91% | Digital vs manual; residential focus |
| ReportMines, 2026 | $1.43B | $1.60B | $3.18B by 2032 | 12.10% | Broad countertop cooking scope |
| Tricity roundup, 2026 | $5.56B | $6.02B | $13.22B by 2035 | 9.1% | Includes oven-style formats |
Within the narrow PW Consulting series, 2024 grew 16.59% year over year to $1.26 billion, 2025 slowed to 7.66%, and 2026 is estimated at 12.20% (PW Consulting, 2026). The growth engine has changed character: 2025 shipment statistics from the Association of Home Appliance Manufacturers show US countertop air fryer volumes stabilized at roughly 2023 levels, so the category now earns growth through higher average selling prices on multifunction and digital units rather than first-time adoption (AHAM, via PW Consulting, 2026). ReportMines likewise attributes its 12.10% CAGR to premiumization and upgrade purchases (ReportMines, 2026). For importers, replacement-cycle SKUs and feature upgrades now matter more than entry-level volume plays.
Regional split and household penetration: the US leads value, the UK leads saturation
North America remains the largest air fryer market by value, but the United Kingdom shows the deepest household penetration — and the two readings do not come from the same scope. The table pairs the two most-cited 2026 splits so the narrow and broad views can be read together.
| Region | Broad estimate (Tricity, 2026) | Narrow estimate (PW Consulting, 2026) |
|---|---|---|
| North America | $2.20B; 39.6% share (2025) | $667.6M (2025) |
| Europe | $1.63B; 29.4% share (2025) | $411.0M (2025) |
| Asia Pacific | Not ranked in top two | $227.0M (2025) |
| Latin America | Emerging | $43.0M (2025) |
| Middle East and Africa | Emerging | $11.5M (2025) |
Penetration readings spread even wider than market values, because ownership surveys differ on single- vs multi-unit households and on who was sampled. In the United States, Sky Market Insights puts 2026 household penetration at 45%, a 2026 statistics roundup reports 67% of US households owning at least one, and a cross-market estimate averages developed-market ownership at about 22%, rising to 28–32% among urban households earning over $75,000 (Sky Market Insights, 2026; Tricity, 2026; Dataintelo, 2026). The UK trend line is clearest: Leatherhead Food Research tracked ownership rising from 30% of households in 2022 to 65% in 2025, with 86% of owners using the appliance at least weekly — roughly 56% of all UK households cooking with one every week (Leatherhead, via Sagentia, 2026). Independent estimates bracket that at 40–55% depending on definition, or 58% with the air fryer ranked the third most-used cooking appliance (IndexBox, 2026; Tricity, 2026). France sits at 27% ownership (Tricity, 2026). Headroom is in emerging markets: penetration in India, Brazil and Indonesia remains below 5%, and 3–7% across emerging markets generally (ReportMines, 2026; Dataintelo, 2026). Finally: 33% of Americans use an air fryer at least weekly, 16% of US consumers plan to buy one within 12 months, and about 12% of existing owners buy a second unit (Tricity, 2026; Dataintelo, 2026).
Product mix: basket formats hold volume while digital and oven styles take value
Basket-style air fryers still command the majority of unit volume in every market measured, but digital controls and oven-style formats are where the revenue is migrating. The mix data below covers the US production base, the UK retail mix and the global digital/manual split.
| Segment | Statistic | Source, year |
|---|---|---|
| Controls | Digital air fryers: 59.8% global share (2025) | PW Consulting, 2026 |
| US production mix | Basket 55% / paddle 25% / oven 20% of units | Sky Market Insights, 2026 |
| UK retail unit mix | Basket 55–60% / oven 25–30% / multi-cooker combo 10–15% | IndexBox, 2026 |
| US end use | Household 60% / commercial 30% / institutional 10% | Sky Market Insights, 2026 |
| End-user value | Residential: 82.4% of market value (2025) | PW Consulting, 2026 |
| Connectivity | 65% of US units feature smart IoT controls (2026) | Sky Market Insights, 2026 |
| Power rating | Average 1,500–1,800 W | Sky Market Insights, 2026 |
The premium end is where the money concentrates. In the UK, models retailing above £120 account for only 10–14% of unit volume but 22–28% of market value (IndexBox, 2026). Usage has deepened: primary-meal cooking — the air fryer as the household's main cooker — has reached an estimated 35–40% of UK usage occasions in 2026, and 70% of owners cook for one or two people with it (IndexBox, 2026; Leatherhead, via Sagentia, 2026). Two behavioral statistics matter for packaging teams: 44% of owners say on-pack air fryer cooking instructions influence their purchase decision, and 31% struggle to know how long to cook foods, so bundled recipe support is a genuine conversion lever (Leatherhead, via Sagentia, 2026). On durability, a 2025 Consumer Reports laboratory evaluation found popular PTFE-coated baskets showing measurable wear after 400–600 simulated cooking cycles, while ceramic coatings degraded more slowly but started with lower non-stick performance (Consumer Reports, 2025). Connectivity has a retention catch: IoT feature usage drops below 35% after 90 days, so app ecosystems alone rarely justify a price premium (PW Consulting, 2026).
Pricing ladders and channel statistics: $100 is the center of gravity
US shelf prices cluster around a $100 midpoint, and roughly three quarters of small kitchen appliance B2C sales happen online. The tier table combines two independent 2026 price guides; where they overlap, the ranges agree within $10–20.
| Format | Typical price | Source, year |
|---|---|---|
| Compact basket, 2–4 qt | $30–80 | LatestCost, 2026 |
| Standard basket, 5–6 qt | $50–150 | LatestCost, 2026 |
| Dual-basket, 8–10 qt | $120–300 | LatestCost, 2026 |
| Dual-basket (alternate estimate) | $130–230 | GoMyReview, 2026 |
| Air fryer toaster oven | $90–350+ | LatestCost, 2026 |
| Smart / app-connected add-on | +$20–60 over base | GoMyReview, 2026 |
| Promotion depth (Prime Day, Black Friday) | 20–40% off list | GoMyReview, 2026 |
Around that ladder, the supporting statistics are consistent: most US shoppers pay about $80–150 for a countertop model, and a dual-basket design commands a $40–100 premium over a comparable single basket (LatestCost, 2026). Amazon US data from July 2026 shows the top ten dual-basket listings averaging $129.83, led by a $99.99 Cosori 6-quart model selling about 20,000 units a month (ASINSight, 2026), and Amazon India reported a 132% year-over-year jump in air fryer sales in the January–March quarter (Tricity, 2026). Running-cost economics support the category against full-size ovens — a typical air fryer session uses about 0.70 kWh against 1.70 kWh for comparable oven cooking (Kitchenware Compare, 2026) — and 62.4% of owners keep the appliance permanently on the countertop (Tricity, 2026).
For the small kitchen appliance market the air fryer sits inside, channel data is the headline: online retail accounted for 75.80% of US B2C small kitchen appliance sales and is growing at a 5.73% CAGR to 2031, with coffee makers leading the US category at 26.70% of 2025 revenue and residential use at 73.40% (Mordor Intelligence, 2026). Globally, online is the fastest-growing distribution channel at a projected 8.1% CAGR through 2033, with the overall market estimated at $60.8 billion in 2026 rising to $87.3 billion by 2033 at a 5.3% CAGR (Persistence Market Research, 2026). Air fryers specifically are forecast to expand at a 4.96% CAGR within the global small kitchen appliance market to 2031 — slower than the dedicated trackers above, another reminder that scope drives every growth number (Mordor Intelligence, 2026).
Manufacturing footprint: nearly half of global production is China-based
China accounts for an estimated 46% of global air fryer production, followed by North America at 23% and Europe at 13% (Tricity, 2026). The supply base is concentrated in Guangdong and Zhejiang, where ODM suppliers undercut established global brands by up to 20% on price, accelerating commoditization at the entry level (ReportMines, 2026). The US retains a domestic base of more than 25 air fryer manufacturing facilities and over 50 registered brands, with those facilities averaging 400,000 units per year (Sky Market Insights, 2026). For brand owners, Chinese ODM capacity sets the global price floor; differentiation has to come from certification coverage, coating durability, energy efficiency and packaging-level cooking guidance rather than hardware alone.

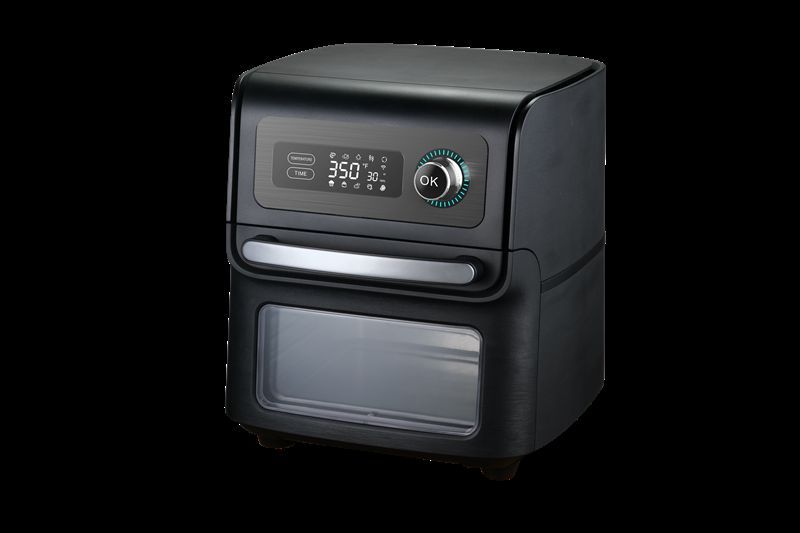
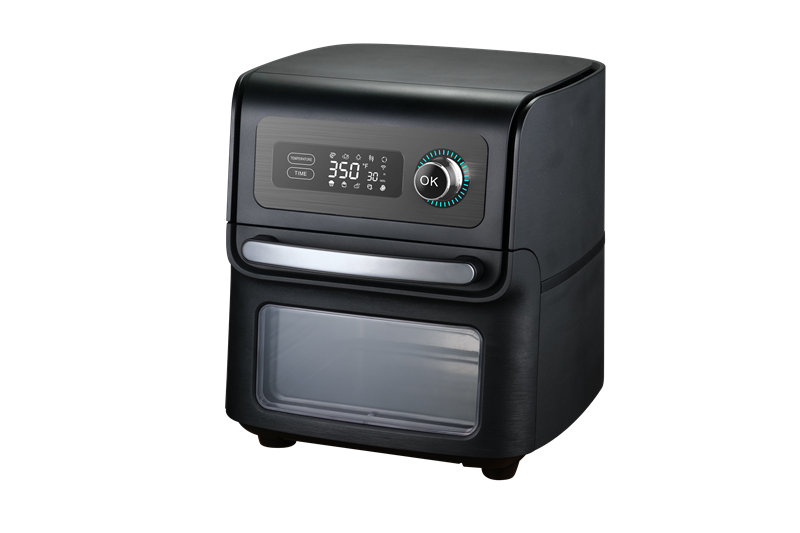
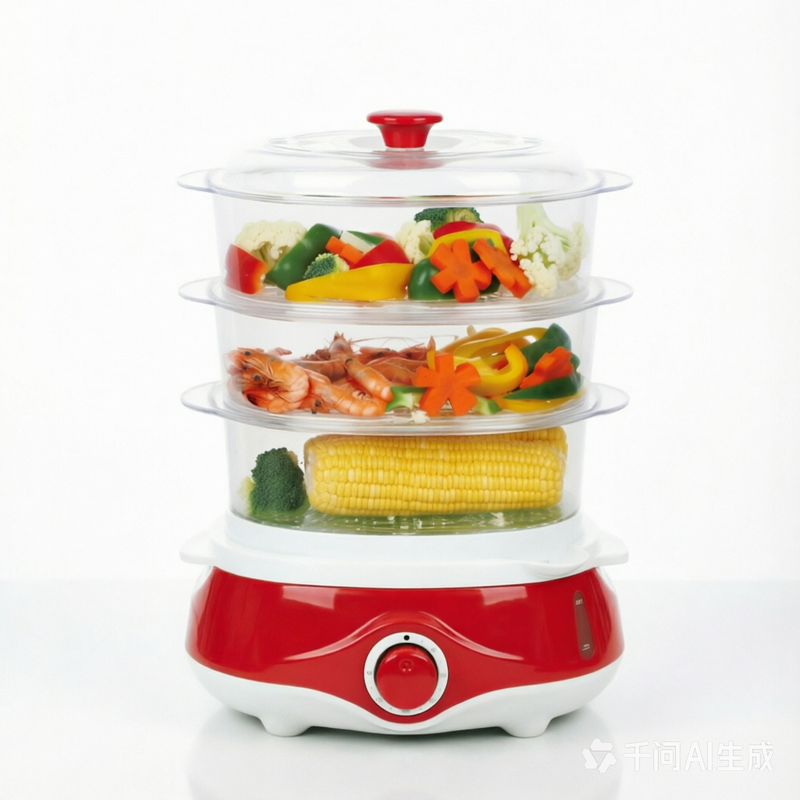
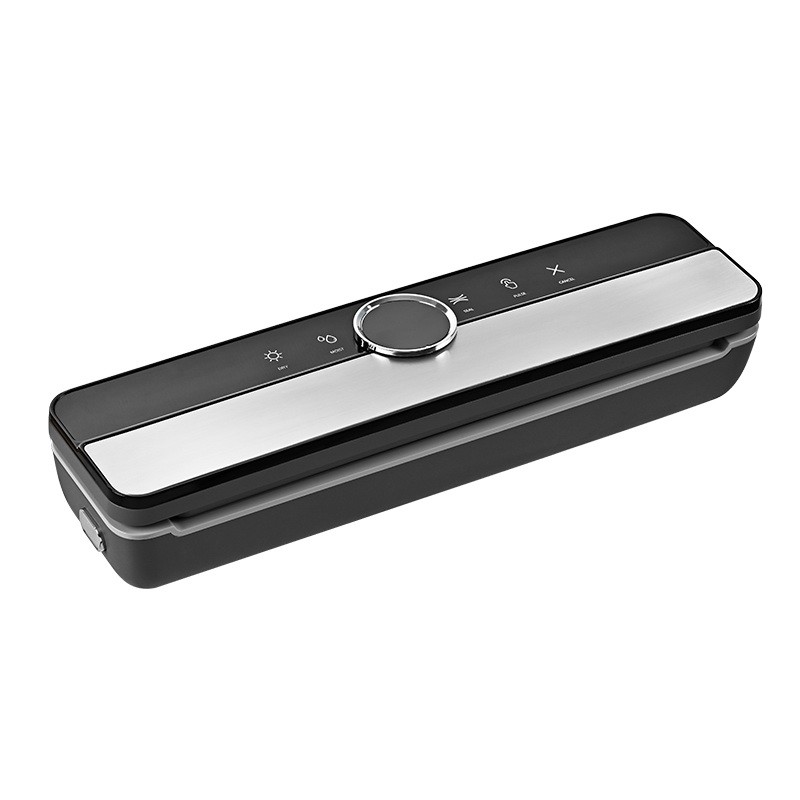
Founded in 1989, Kangye Electric operates a 150,000㎡ manufacturing base in Foshan with 200+ engineers and monthly capacity above 200,000 units under ISO 9001, with CE, GS, CB, ETL, LFGB and FDA certification coverage. Its KYS-116 series — the 16 L, 1,800 W digital air fryer oven with 8 preset functions shown above — packs 780 units into a 20 ft container (workshop-calibration figure), a container density that keeps landed cost competitive at the premiumized price points 2026 channel data rewards. The same platform thinking extends across the counter category: the KYS-303A 3-tier 11 L food steamer serves the health-cooking adjacencies growing alongside air fryers, and the KYS-960 vacuum sealer covers the food-preservation aisle.
Sourcing an Air Fryer Program for 2027?
Kangye Electric builds the KYS-116 16 L digital air fryer oven line plus steamers, dehydrators and vacuum sealers on one 150,000㎡ ISO 9001 campus, with CE/GS/CB/ETL/LFGB/FDA coverage and published container quantities.
See the KYS-116 seriesFrequently asked questions
Why do air fryer market size estimates differ so much?
Scope. Published 2026 figures for the same year range from $1.53 billion (PW Consulting, 2026) to $6.02 billion (Tricity, 2026), and the widest-scope trackers that fold in oven-style and hybrid formats reach $20.99 billion by 2027 (Fortune Business Insights, 2026). Check whether a figure counts basket units only or the whole countertop-cooking complex before quoting it.
Are US and UK air fryer markets saturated?
Approaching it, with definitional spread: US penetration readings run 45–67% (Sky Market Insights, 2026; Tricity, 2026) and UK ownership hit 65% in 2025 with 86% of owners using it weekly (Leatherhead, via Sagentia, 2026). Growth has shifted to replacement, second-unit purchases (12% of owners) and premium upgrades rather than first-time adoption (Dataintelo, 2026; AHAM via PW Consulting, 2026).
What do the 2026 pricing statistics mean for private-label importers?
Aim the core range at the $80–150 sweet spot where most US purchases land (LatestCost, 2026), and reserve dual-basket and oven-style formats for the premium tier, which captures 22–28% of UK value from 10–14% of units (IndexBox, 2026). Budget for 20–40% promotional depth in Q4 planning, because that is what the channel actually sells at (GoMyReview, 2026).
Which channels and regions are growing fastest?
Online: 75.80% of US small kitchen appliance B2C sales flow through e-commerce, growing at 5.73% CAGR to 2031 (Mordor Intelligence, 2026), and online is the fastest-growing channel globally at 8.1% CAGR (Persistence Market Research, 2026). Asia Pacific is the fastest-growing region at a 6.5% CAGR, with penetration in India, Brazil and Indonesia still below 5% (Persistence, 2026; ReportMines, 2026).
Sources and data notes
Sources: 360iResearch (2026); PW Consulting (2026, including AHAM 2025 shipment statistics); ReportMines (2026); Tricity Local News statistics roundup (2026); Fortune Business Insights (2026, widest scope); Leatherhead Food Research via Sagentia (2026); IndexBox (2026); Sky Market Insights (2026); Dataintelo (2026); LatestCost (2026); GoMyReview (2026); ASINSight (July 2026); Kitchenware Compare (2026); Consumer Reports (2025); Mordor Intelligence (2026); Persistence Market Research (2026). KYS-116, KYS-303A and KYS-960 specifications and the 780-unit 20 ft container figure are live Kangye Electric product data (2026); container quantities are workshop-calibration figures. All figures are quoted as published, not adjusted or extrapolated; each statistic carries its year and source inline at the point of use.